Placer.ai | 2023 - 2024
The Export Tool:
Data Workflow Automation
SUMMARY
The Export Tool was designed to empower customers to build, customize, and automate their own data feeds. By moving away from a support-heavy manual model, we aimed to deliver instant value to users while significantly reducing the operational load on our internal teams.
THE OUTCOME
Established the foundational architecture for a high-density data tool that transitioned from an internal beta to a successful product launch.
BUSINESS MODAL
B2B SaaS / PLG
DEVICE
Desktop
COLLABORATORS
Senior Product Designer (me), Product Manager, Director of Product Design, Solutions Engineering
From Manual Bottleneck
to Scalable Delivery
Previously, custom bulk data requests were a manual bottleneck. Users across monitoring, analysis, and integration categories relied on Support to configure feeds manually. This was a high-touch process that strained staff capacity and delayed client outcomes.
Extended turnaround times due to mandatory Support intervention
Manual steps caused frequent inaccuracies and repetitive back-and-forth over specs
The process was a significant time-drain, diverting Support from higher-value tasks
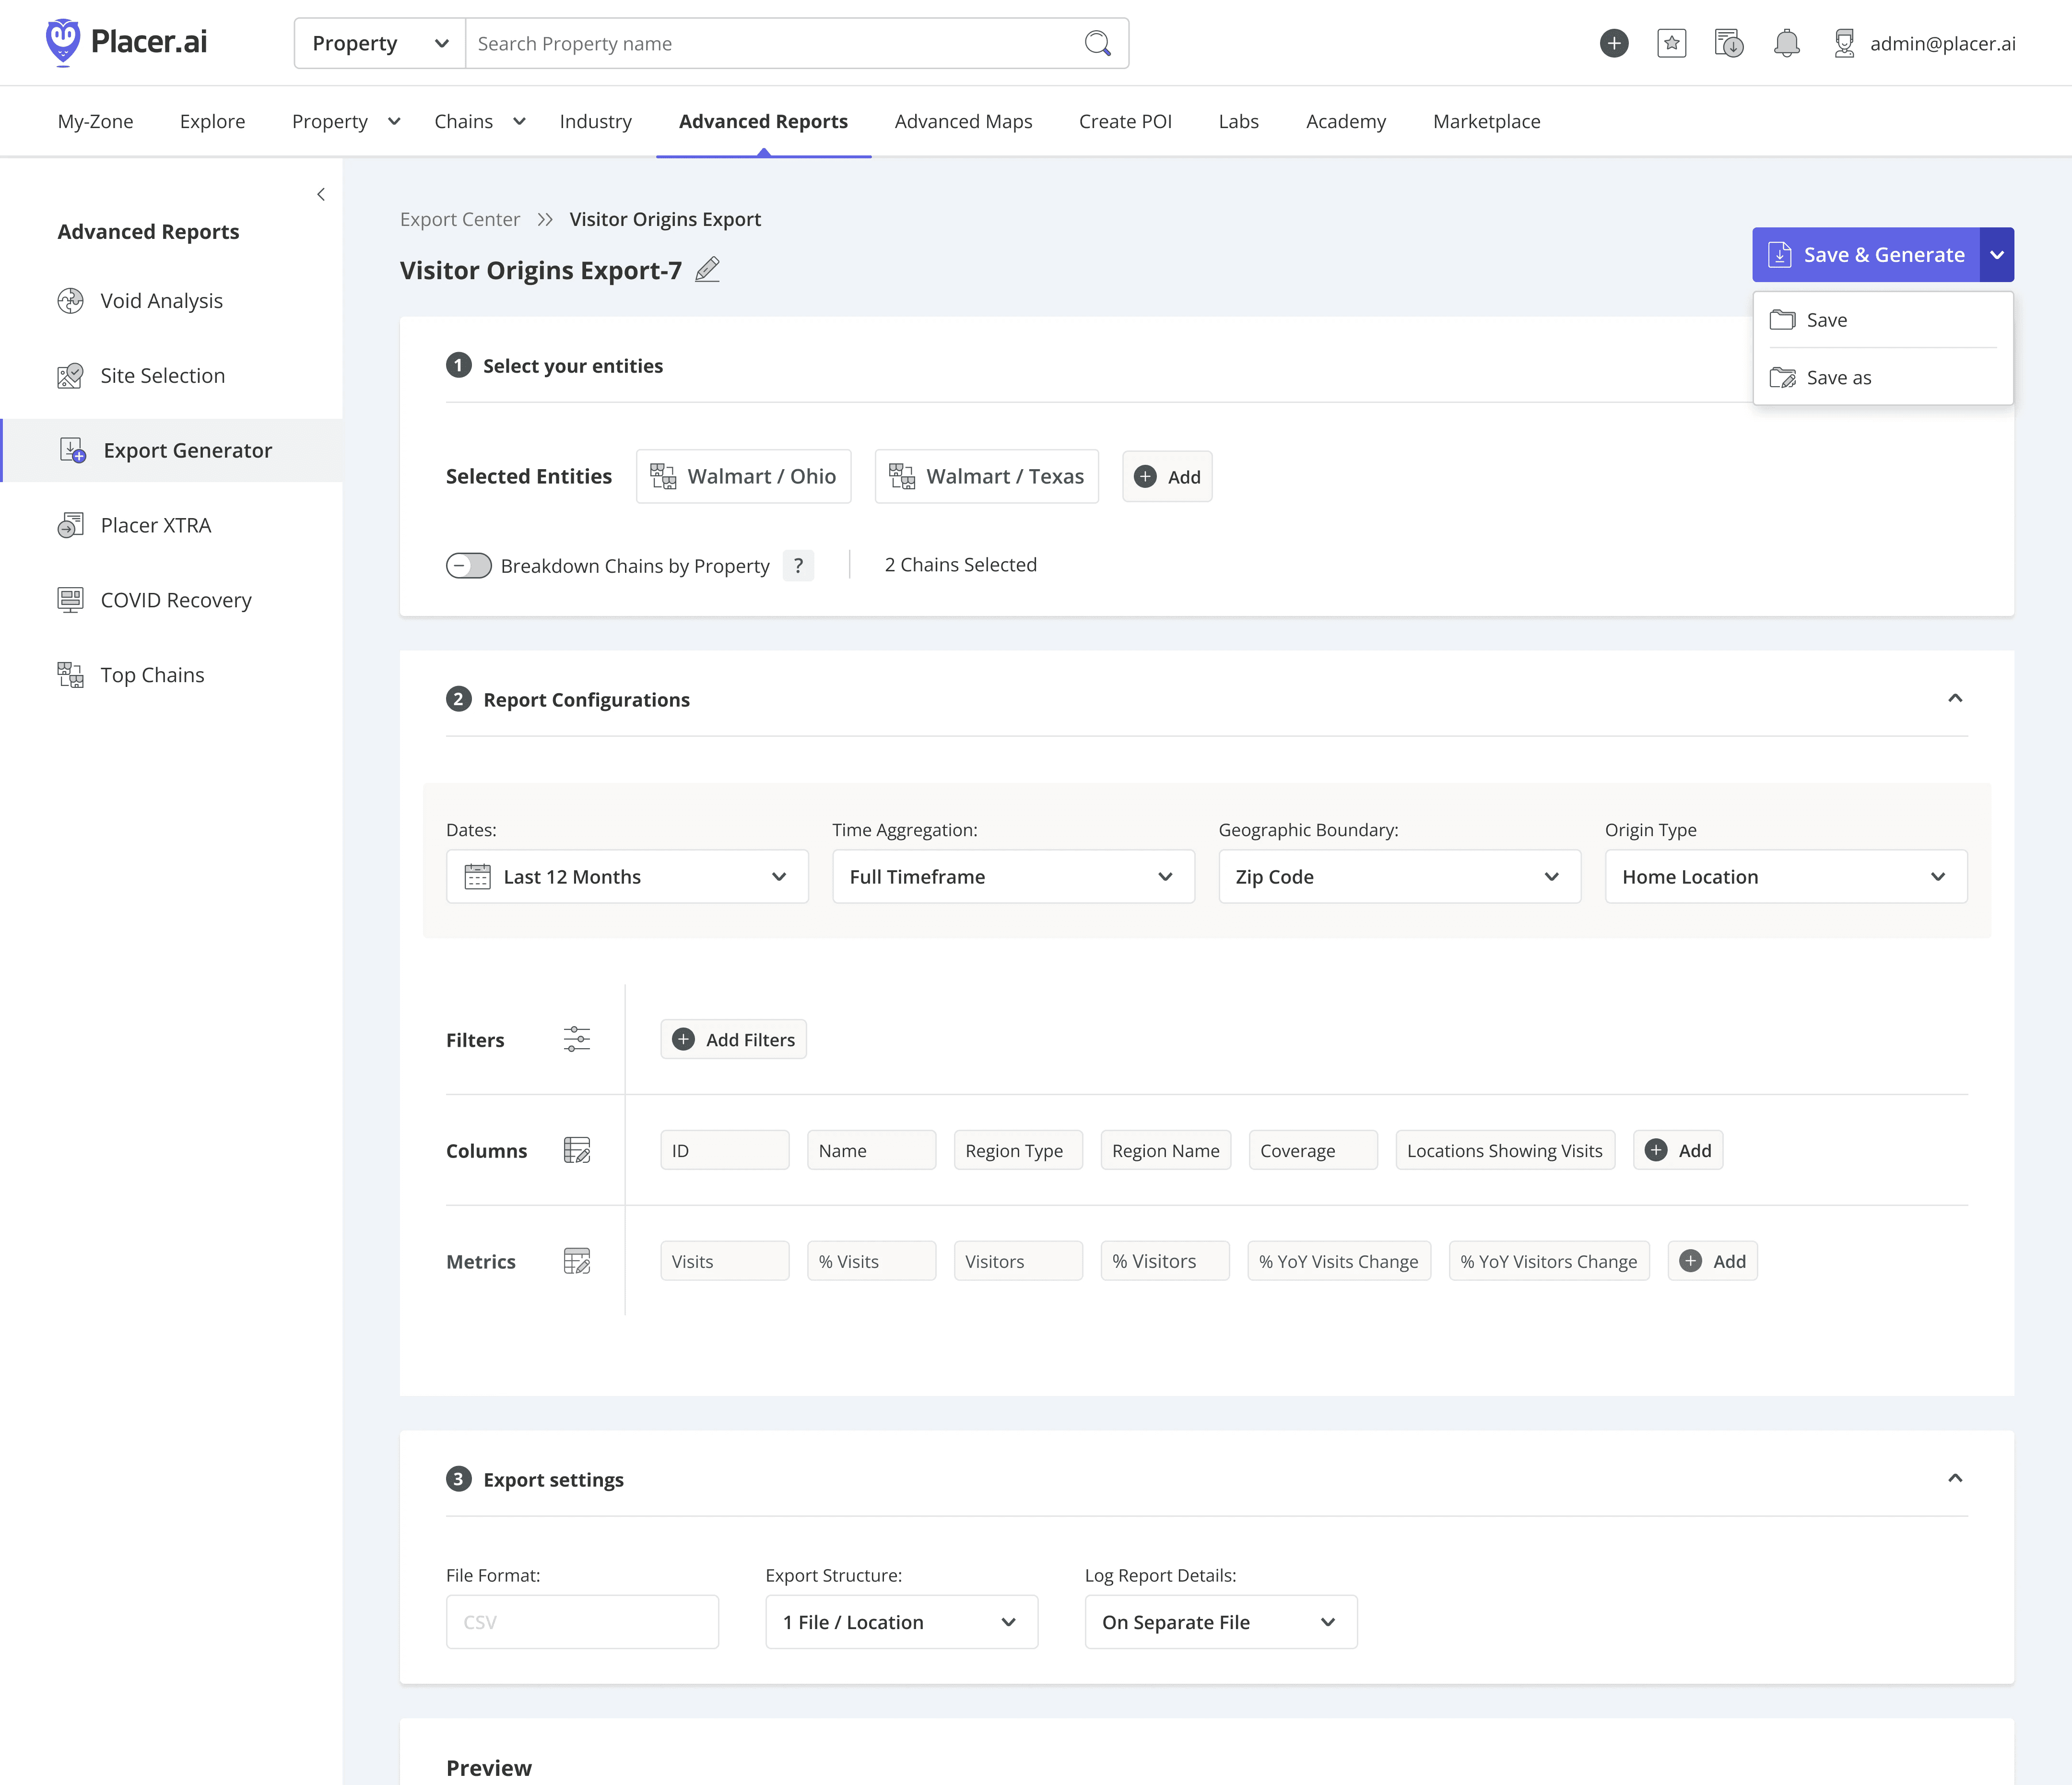
Defining the MVP & User Experience
To resolve these pain points, the Product Manager and I defined an MVP focused on automated, user-driven customization

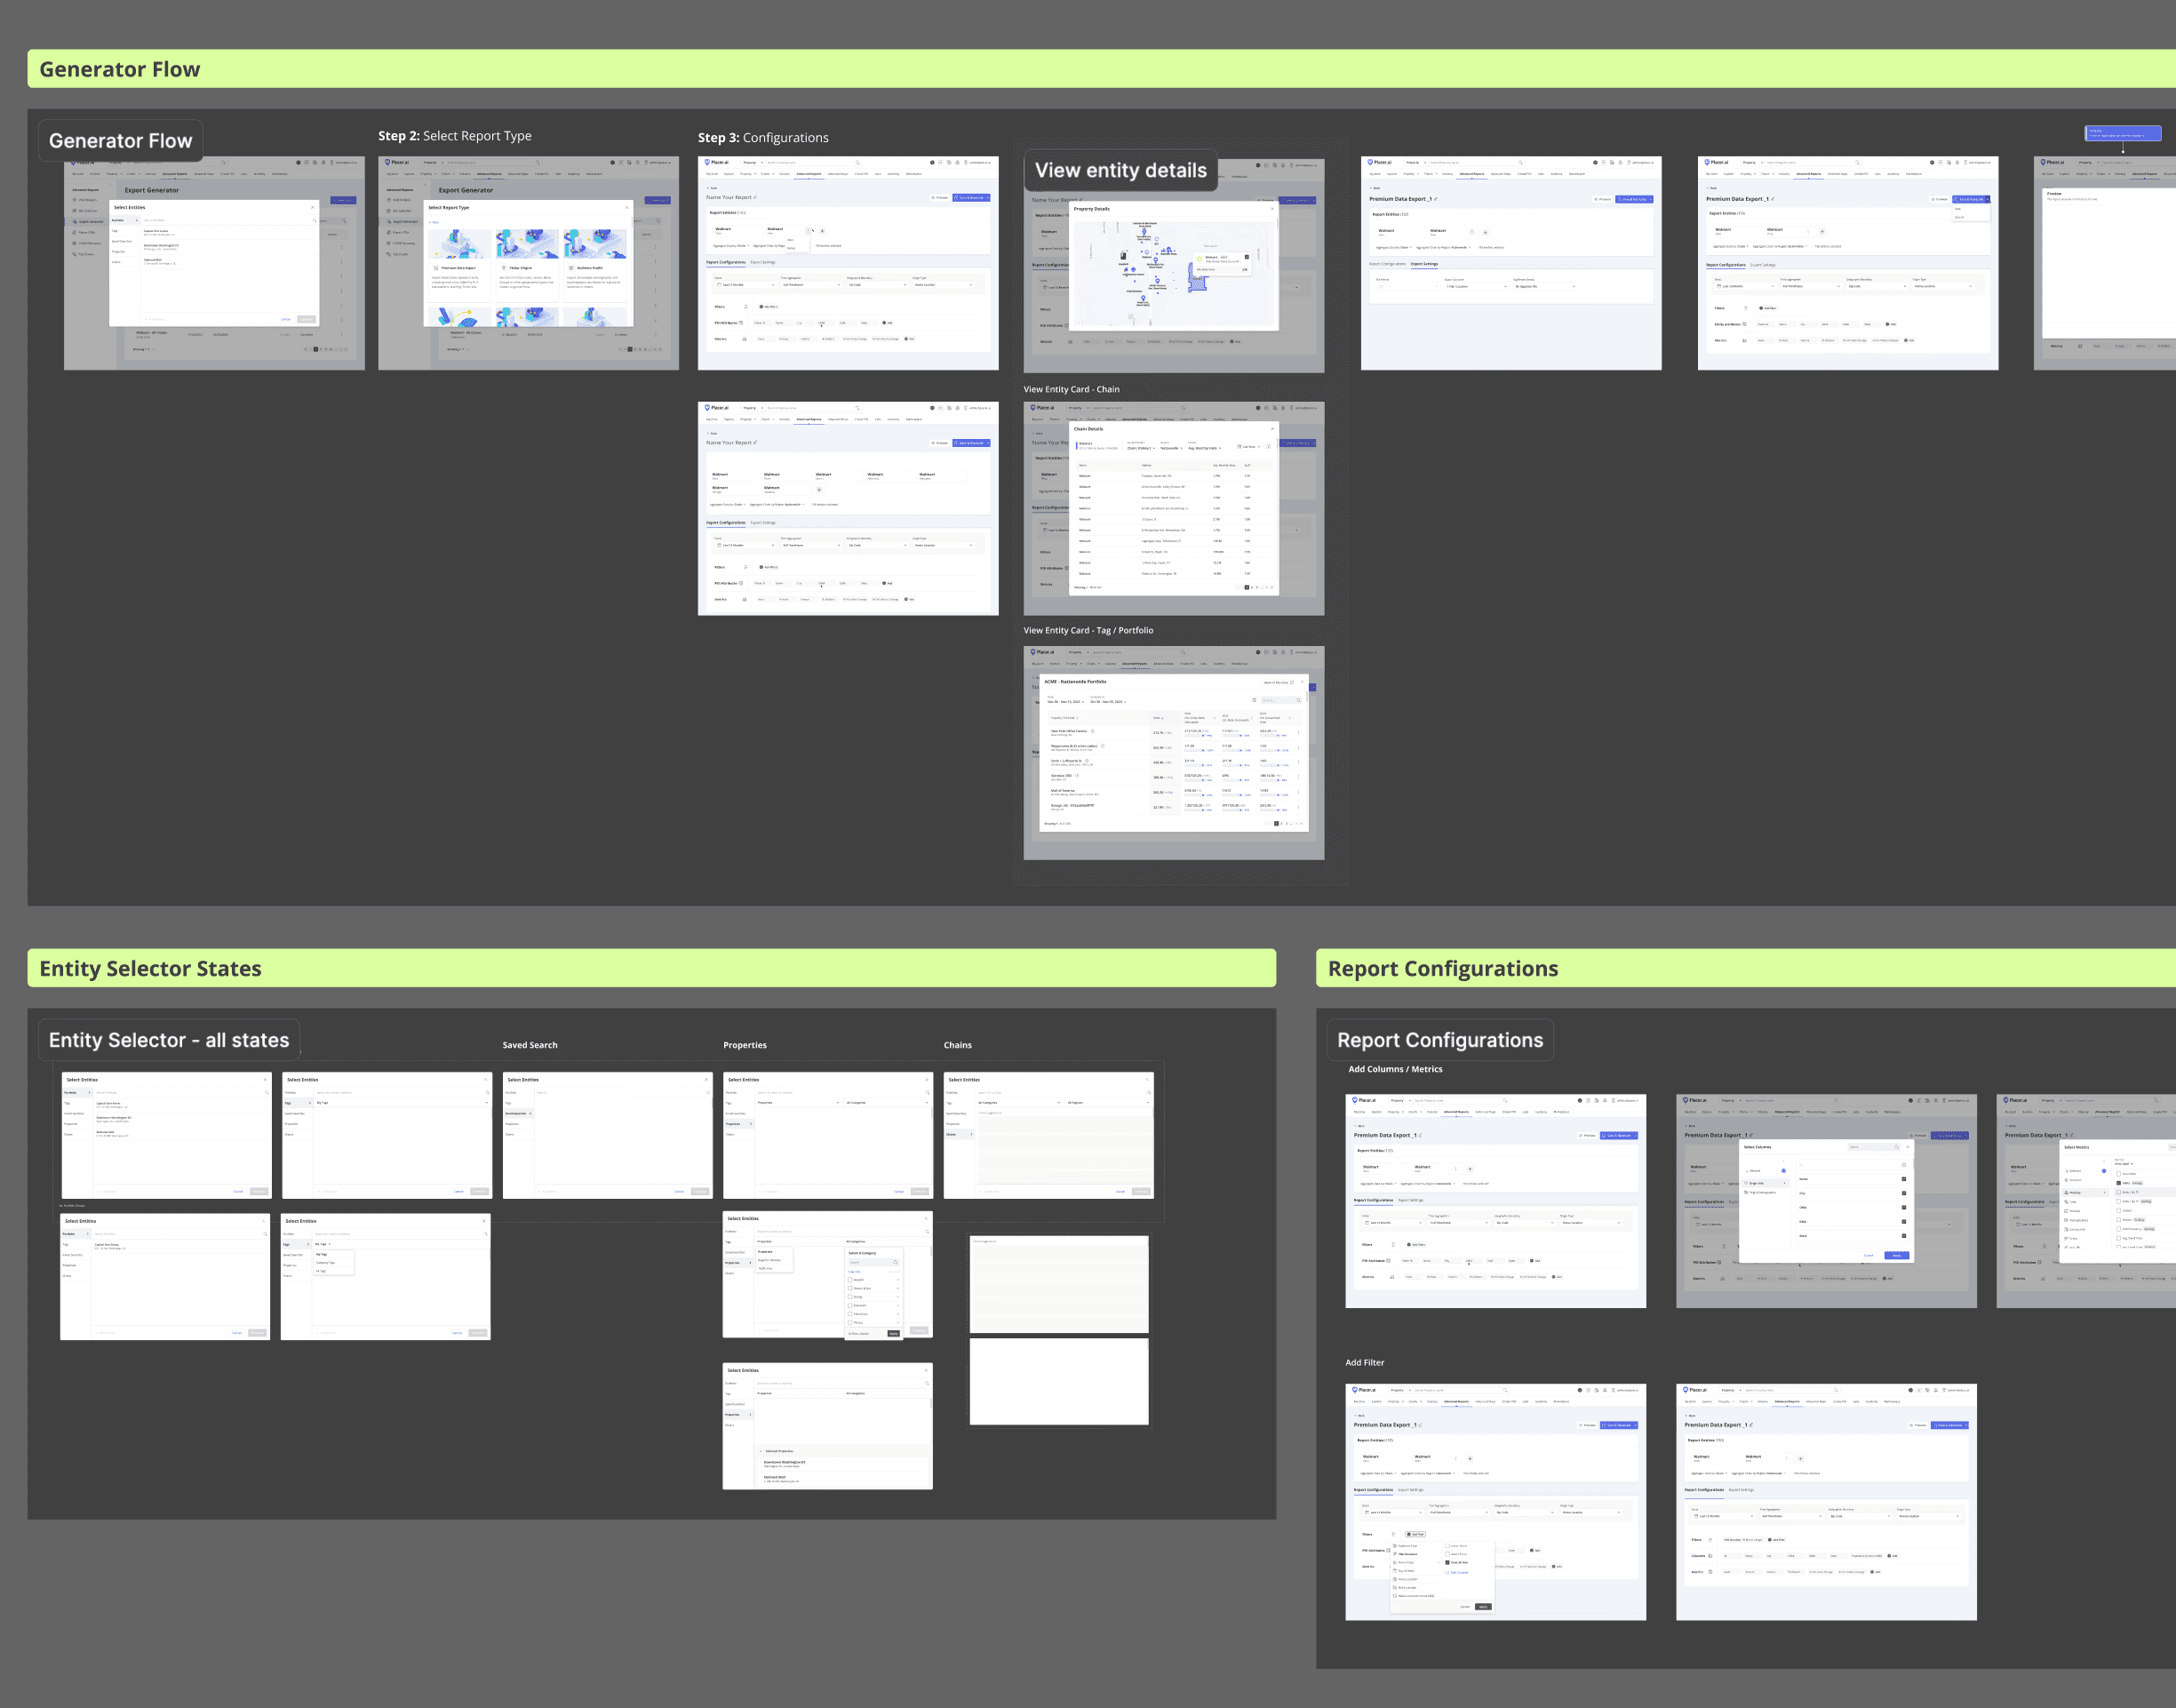
I inherited initial wireframe concepts and performed a comparative analysis to identify the most scalable direction. I evolved these findings into cohesive low-fidelity mockups, establishing a logic-based framework that served as the project's reference point for alignment with Product Management.
Using the low-fidelity flow as a blueprint, I led a series of rapid iteration cycles. This involved presenting to cross-functional stakeholders, defending design decisions, and refining the workflow to balance user needs with technical feasibility before moving into high-fidelity prototyping.
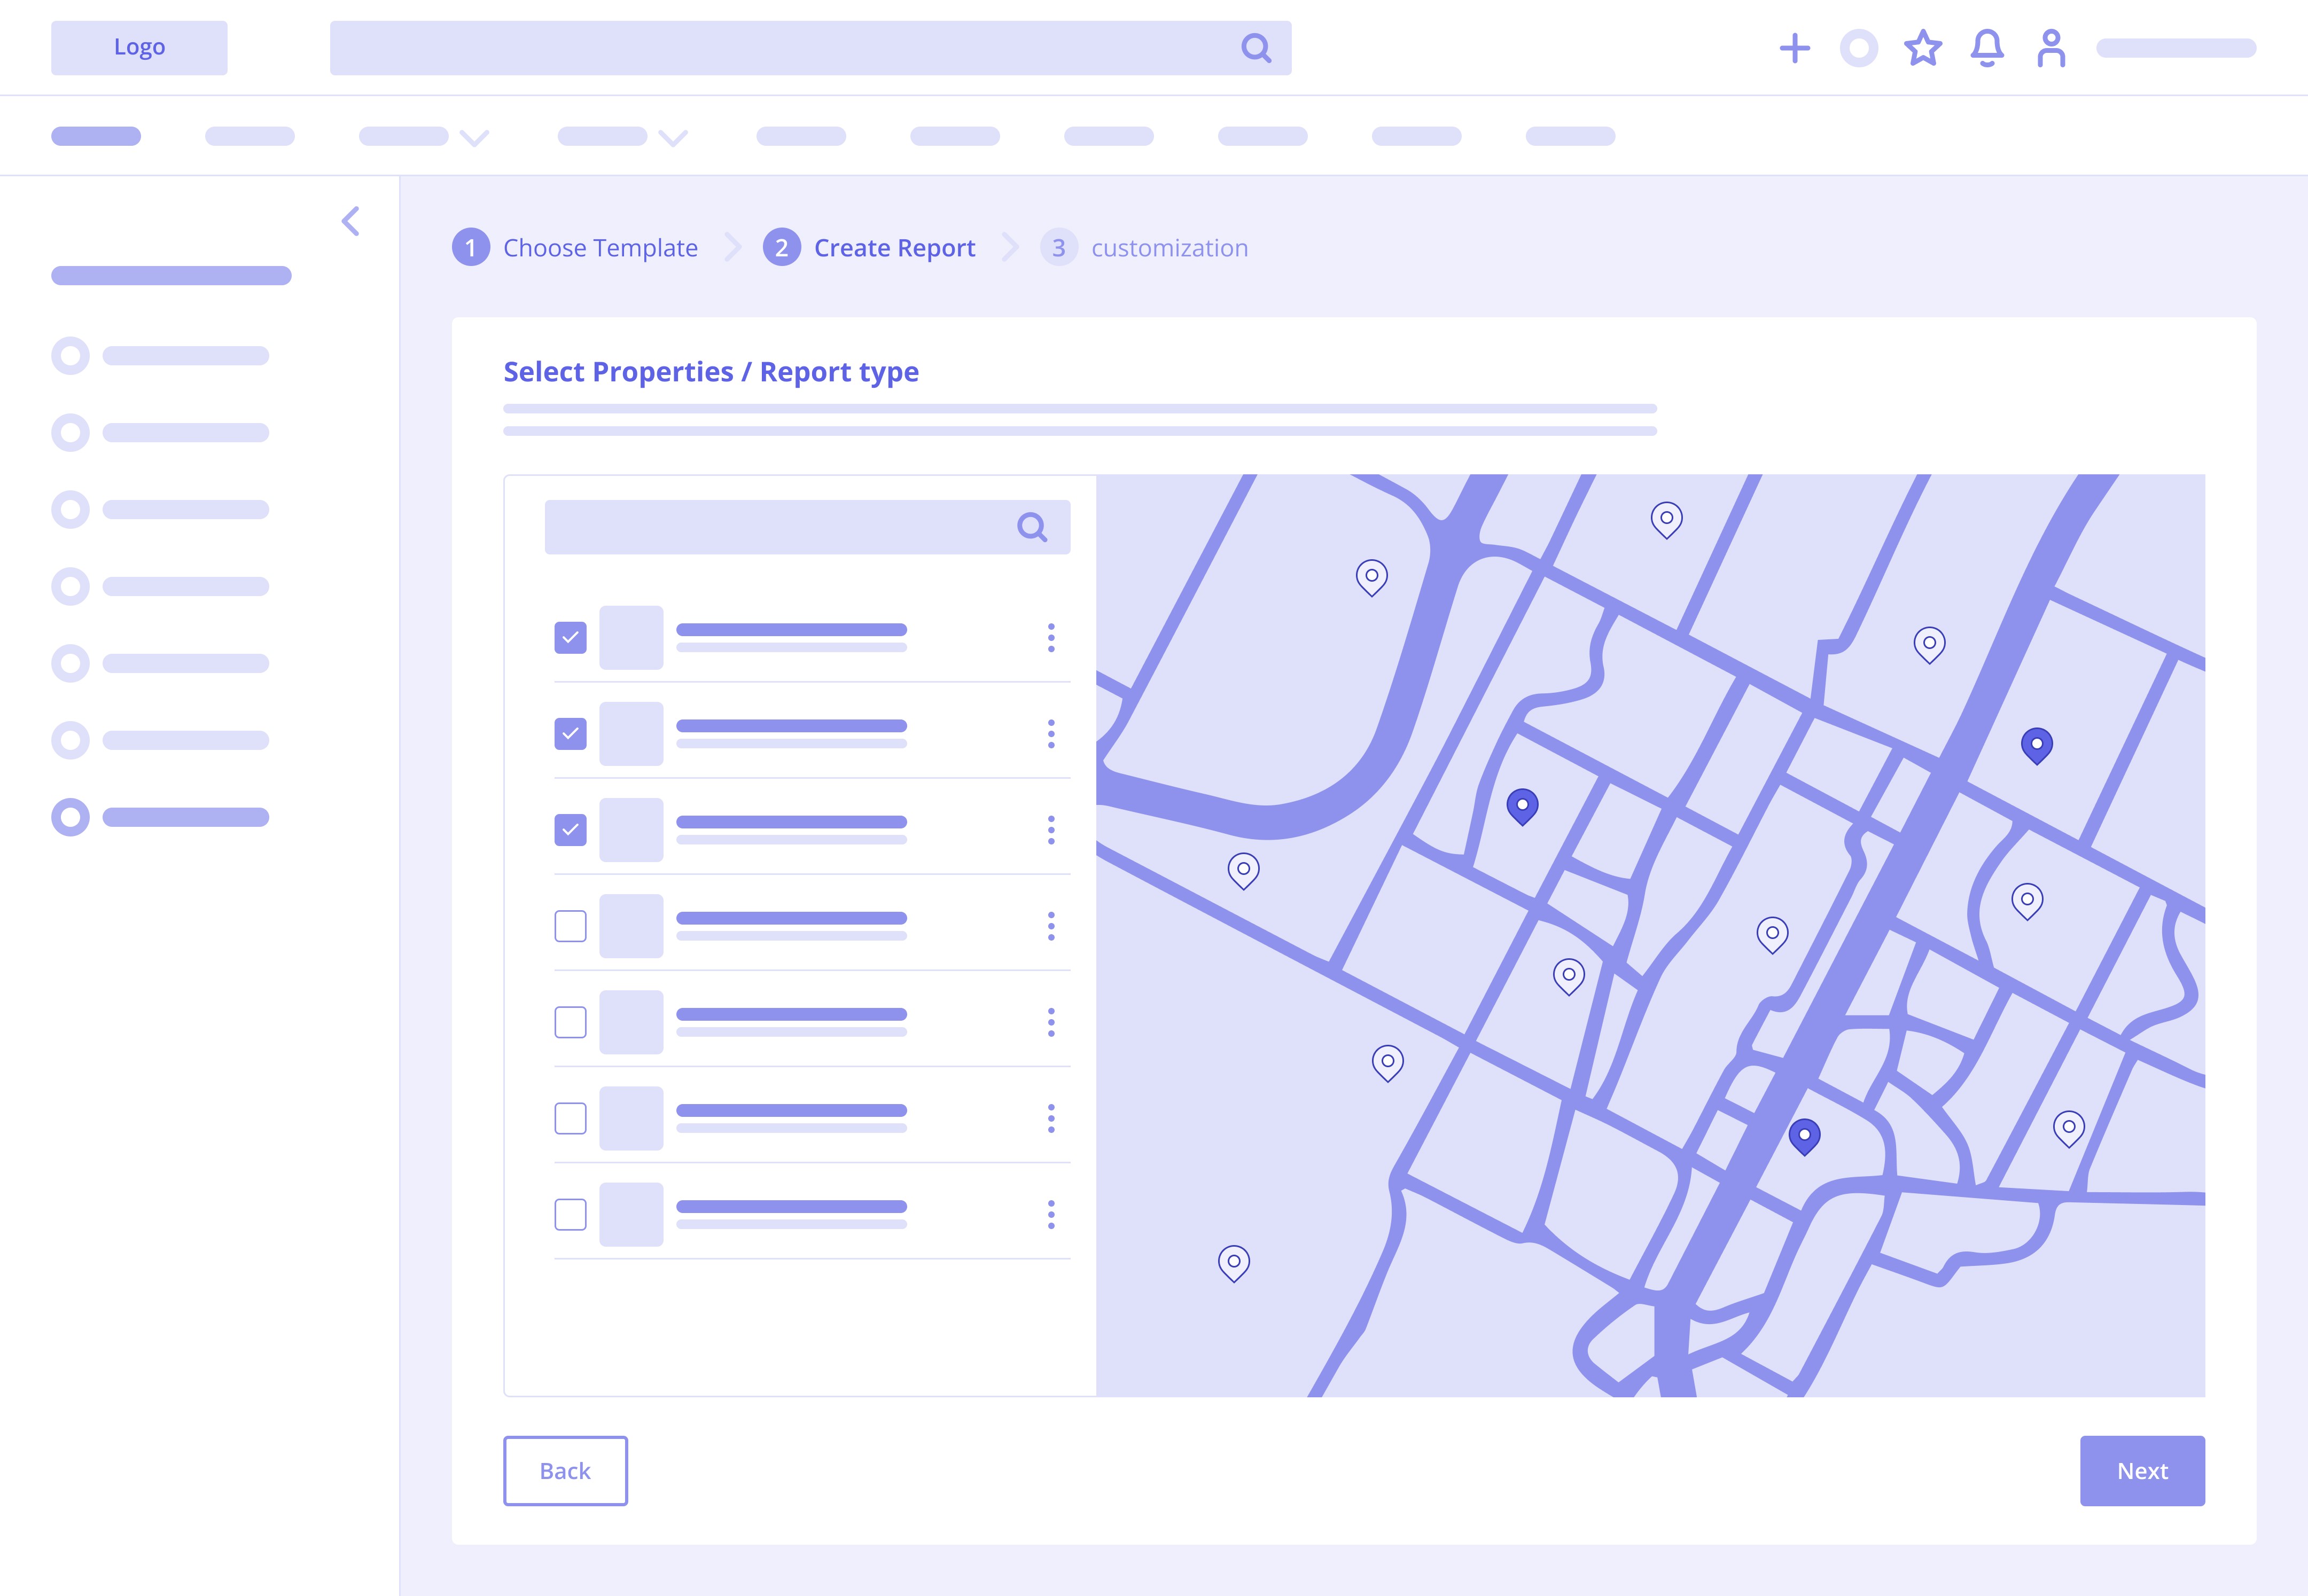
Initial wireframing and Low-fidelity exploration
Mapping the Core Flow
With the UI direction established, I focused on architecting a seamless transition from the core dashboard into the Export Tool, prioritizing the user journey through these three strategic design principles:
Seamless Continuity: Entry points automatically populate active data, removing redundant steps in the user journey.
Reduced Barrier to Entry: Pre-filled templates provide a 'ready-to-go' starting point for common report types.
Information Architecture: Used progressive disclosure to maintain a clean interface despite the technical complexity of the data export configurations.
Starting Point 1

Starting from an empty state

Step 1: Define entities to initialize the configuration.
Starting Point 2

Contextual shortcut: Auto-populates location data, skipping Step 1

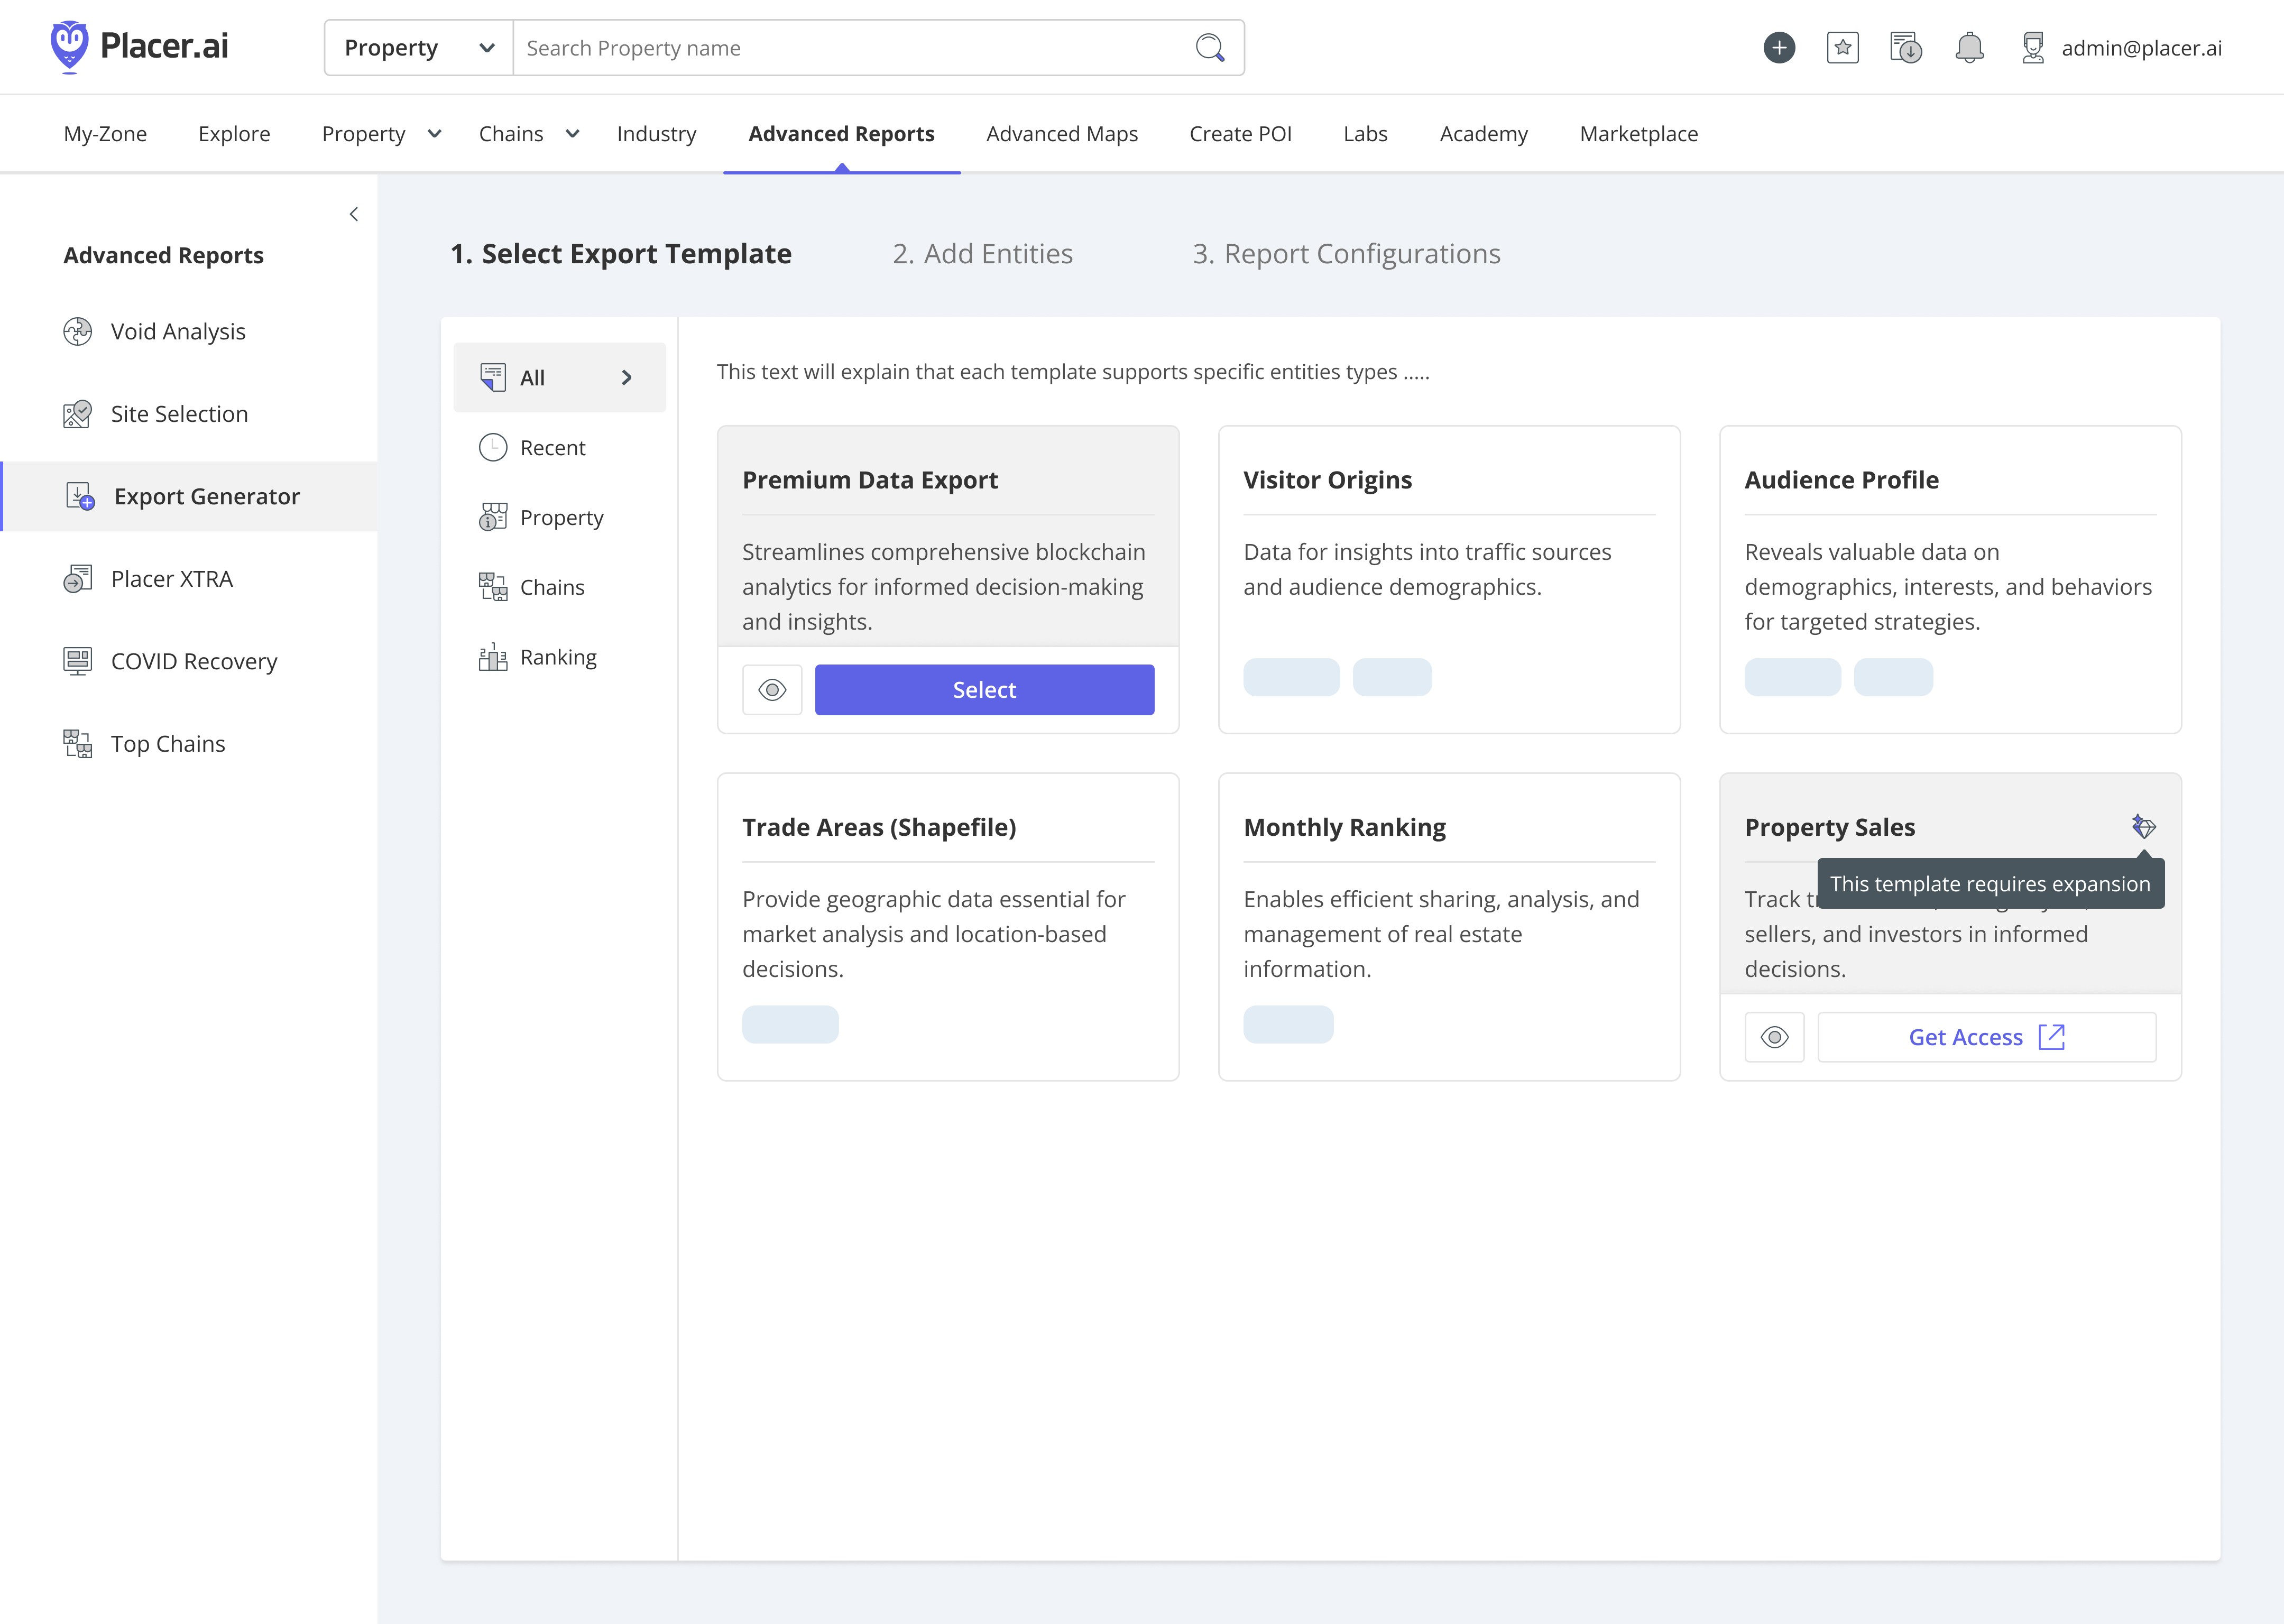
Step 2: Select template (contextually filtered by entity type)

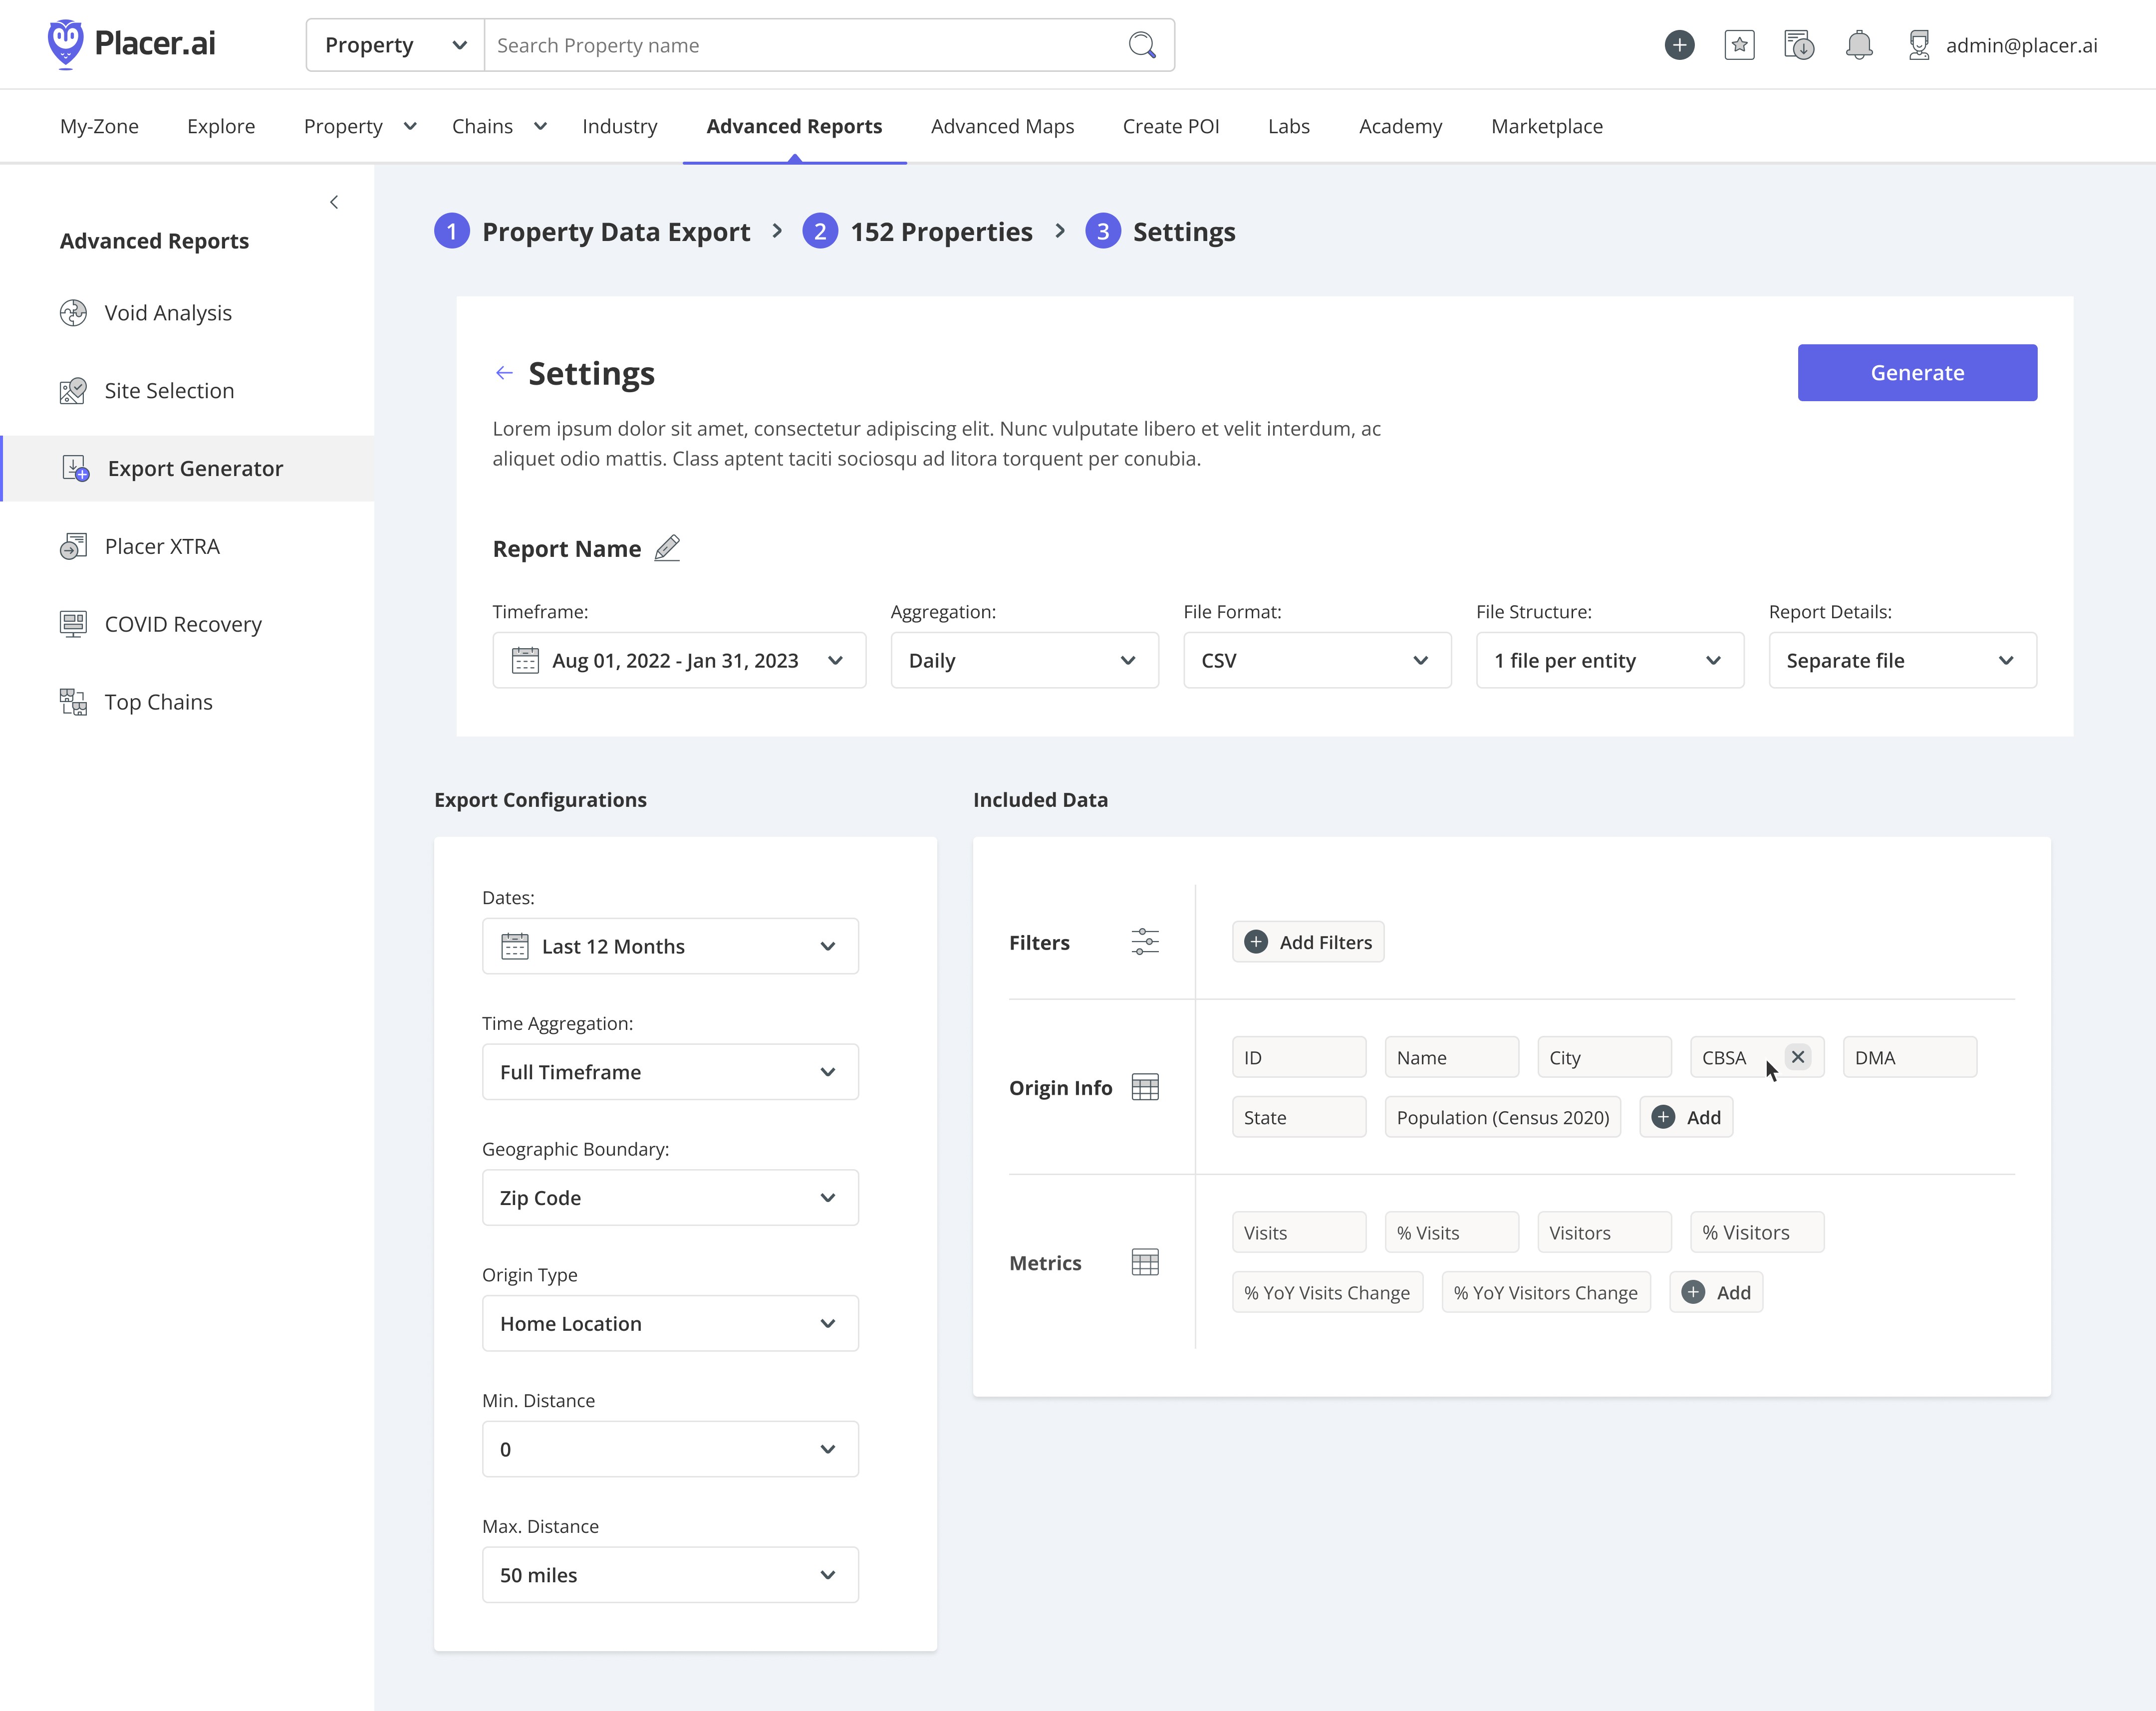
Step 3: Auto-populated tool view reflecting template configurations

Post-save preview: Verifies data and enables sharing and scheduling
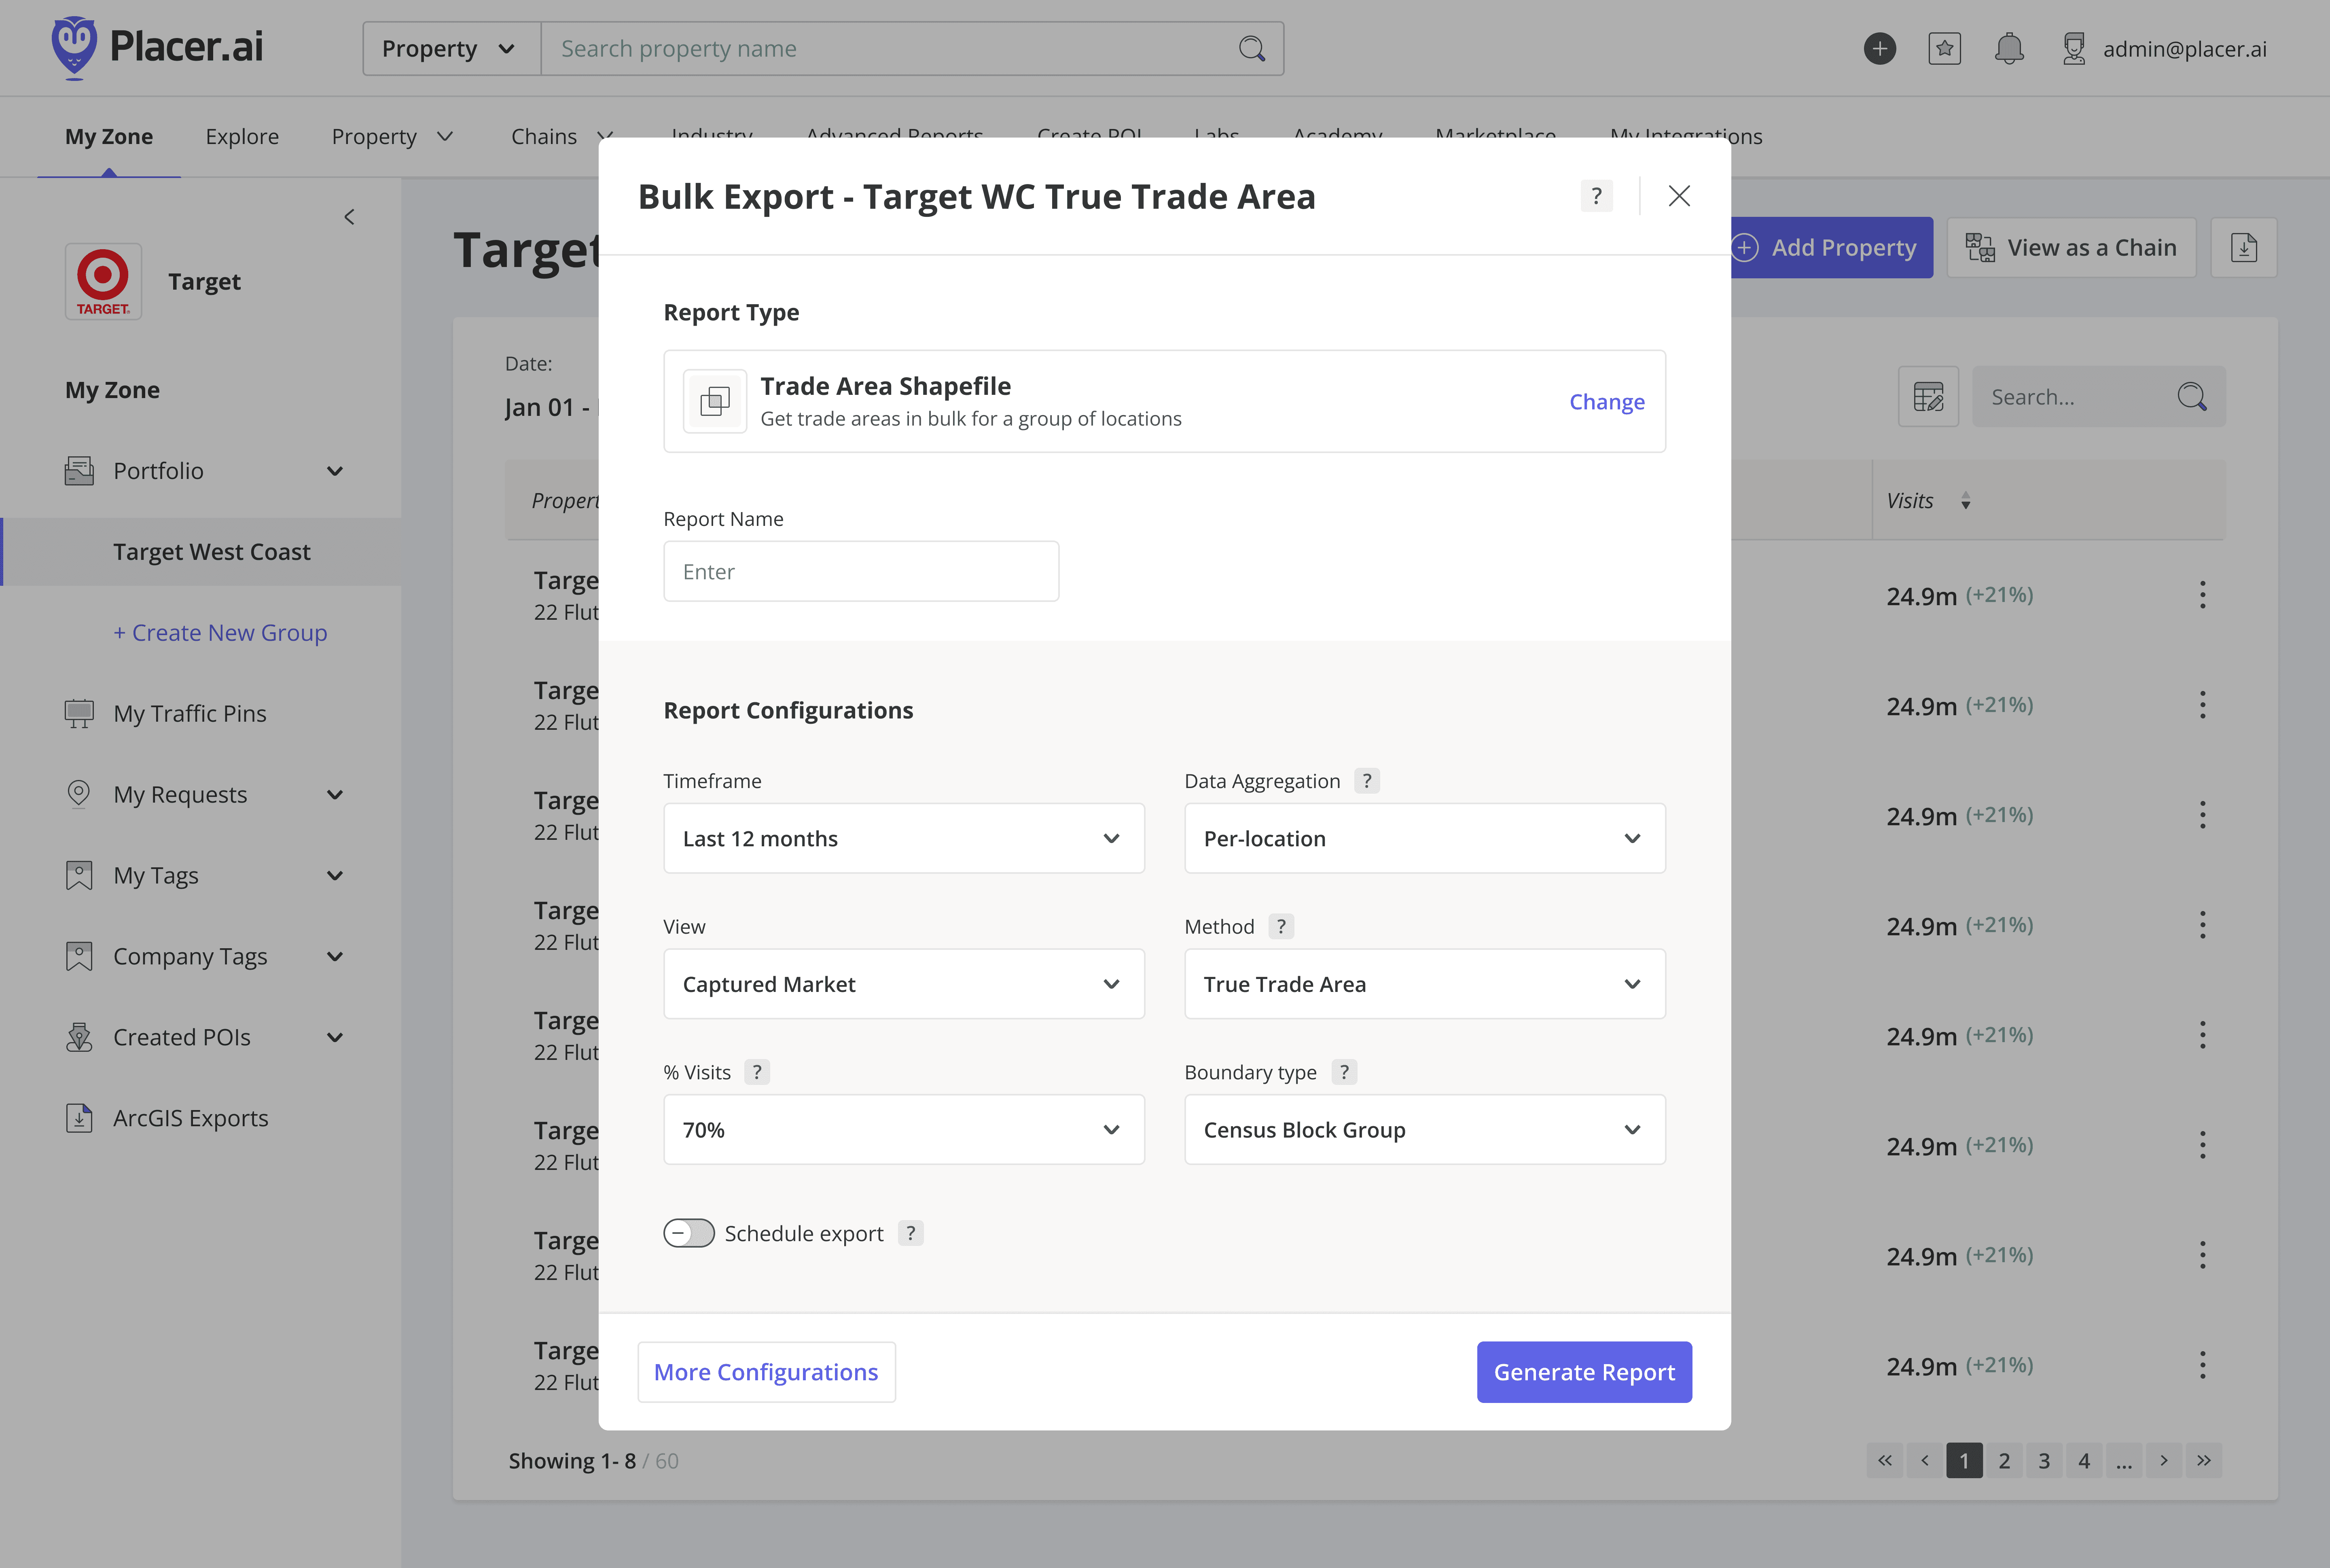
Prototyping & User-Testing
To ensure the tool met diverse market needs, I built high-fidelity prototypes tailored to specific industry verticals. We conducted structured usability testing sessions which were critical in uncovering overlooked pain points - specifically regarding the need for even deeper automation within the configuration process.
I immediately iterated on the designs to address these findings, categorizing the changes into two streams: immediate refinements for the MVP to solve high-priority friction, and strategic features for the 2026 roadmap. This ensured the beta launch was lean, validated by real users, and highly impactful.
Low-fi exploration: Refining the process further based on usability insights
A Robust Control Center
The final interface functions as a centralized hub, empowering users with total control through a consolidated action suite and granular permission logic:
The Action Suite: I designed a comprehensive control layer that allows users to download, preview, edit, and duplicate exports, as well as schedule recurring feeds for automated reporting.
Governance & Privacy: We established strict permission tiers for report owners versus shared users, ensuring data integrity and security while enabling seamless collaboration across the customer’s organization.

Dynamic action suite: Tailoring the interface based on user permissions.


Permission-gated access: Owner-only sharing controls
As my first project on the core Placer.ai platform, I conducted a deep-dive into the technical logic of recurring data feeds and edge-case configurations. Recognizing the project's history of shifting ownership, I prioritized operational transparency. I rebuilt the Figma architecture from the ground up - standardizing user flows and component logic - to ensure the system remained intuitive for stakeholders and ready for a seamless developer handoff.
Logic-first structure for intuitive navigation and handoff
System Integrity & Consistency
Throughout the design process, I partnered closely with the Design System team to ensure 100% compliance with our UI framework. By auditing the final experience against established patterns, I avoided creating redundant UX debt and ensured that all new components were built for future reuse. This collaboration was instrumental in delivering a seamless, platform-aligned transition into the successful beta release.
Impact & Strategic Outlook
While resource shifts temporarily paused development, the foundational design and user insights I established remained the strategic blueprint for the product.
The MVP beta launched during my maternity leave, and its successful release - backed by positive client feedback - validated the resilience of the original architecture. Today, my work continues to serve as the structural framework for all planned feature expansions through 2026.
Had I overseen the full MVP Beta rollout, my focus would have shifted to validating the design’s impact through three key performance indicators (KPIs):
Efficiency Gains: Tracking 'Time-to-Export' to quantify how much the contextual entry points and templates reduced user friction.
Workflow Optimization: Running A/B tests on the 'Streamlined' vs. 'Custom' flows to identify where users prefer automation over manual control.
Support Impact: Monitoring the volume of export-related support tickets to measure the tool’s intuitiveness and self-service success.